
In today’s fast-moving business environment, data is everywhere—but turning it into actionable insights often feels painfully slow. Marketing teams juggle dashboards across Google Analytics, HubSpot, Meta Ads, and LinkedIn. SaaS companies track MRR, churn, and pipeline health in separate tools. Agencies scramble to pull client reports before Monday meetings. Traditional analytics requires SQL queries, manual exports, or waiting for a data analyst who’s already booked solid.
The result? Hours lost hunting for answers, delayed decisions, and reports that show what happened but rarely explain why. Databox Genie changes that equation. As a built-in AI analyst, it lets anyone on your team ask performance questions in plain English and receive contextual answers with explanations and, where relevant, supporting visualizations and trends—pulled directly from your live, standardized data. Without coding or complex manual analysis, teams can get answers faster and spend less time going back and forth on reporting questions.
What Is Databox Genie?
Databox Genie is an AI analyst embedded directly inside the Databox platform. It is available on all paid Databox plans except the Starter Agency plan. It is not included in Databox’s forever free plan, and Databox also offers a free 14-day trial of the Growth plan for teams that want to evaluate Genie with live connected data.
It works with the data you’ve already connected inside Databox, helping teams analyze metrics, trends, goals, and forecasts across a wide range of business data sources. Unlike general-purpose AI tools, Databox Genie is designed to produce answers that are more relevant to your actual business context.
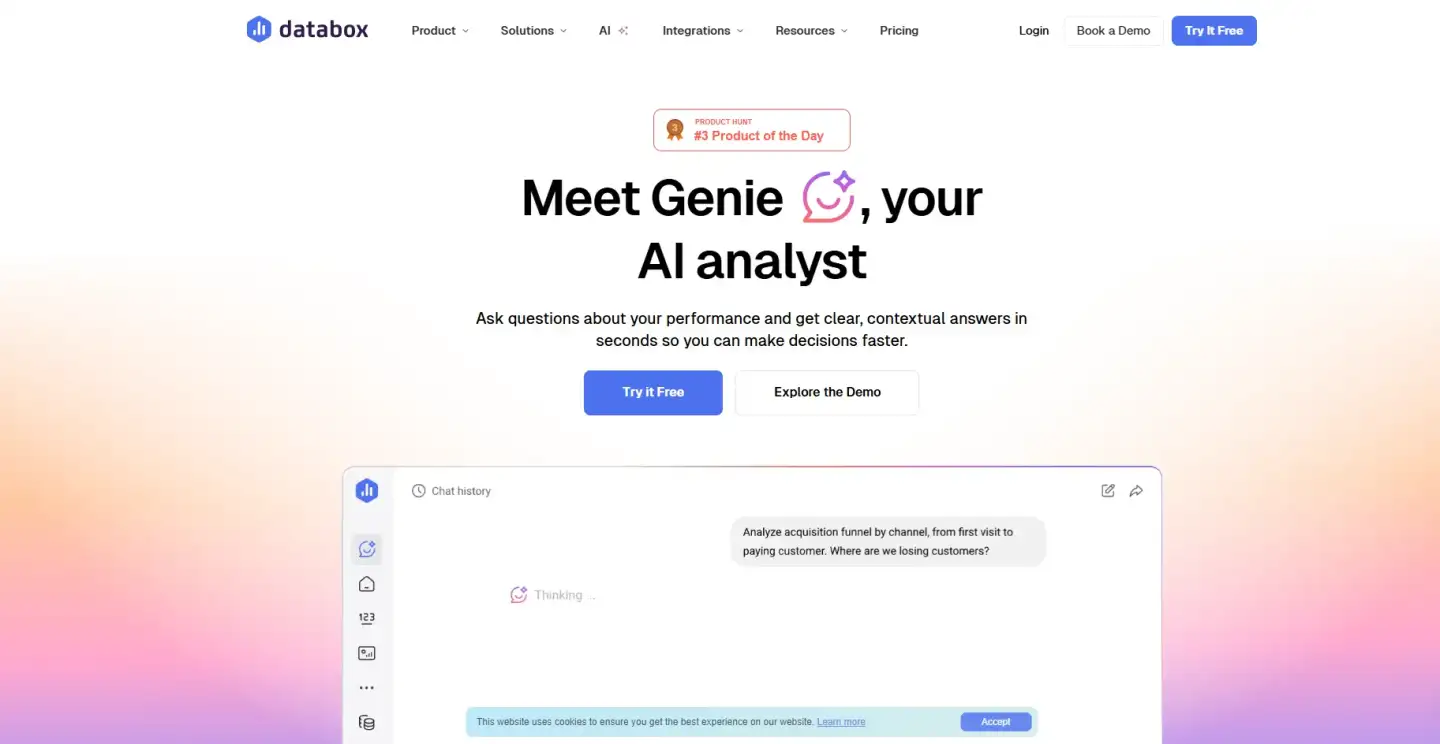
Think of it as conversational performance analysis. You type a question the way you’d speak to a sharp analyst—“Why did revenue change last month?”—and Genie delivers a reasoned response grounded in your actual numbers. It doesn’t just surface data; it connects the dots, highlights what matters, and suggests where to look next.
For marketing, SaaS, and agency teams already overwhelmed by dashboards and reporting cycles, Genie helps reduce the time between asking a question and getting a useful answer.
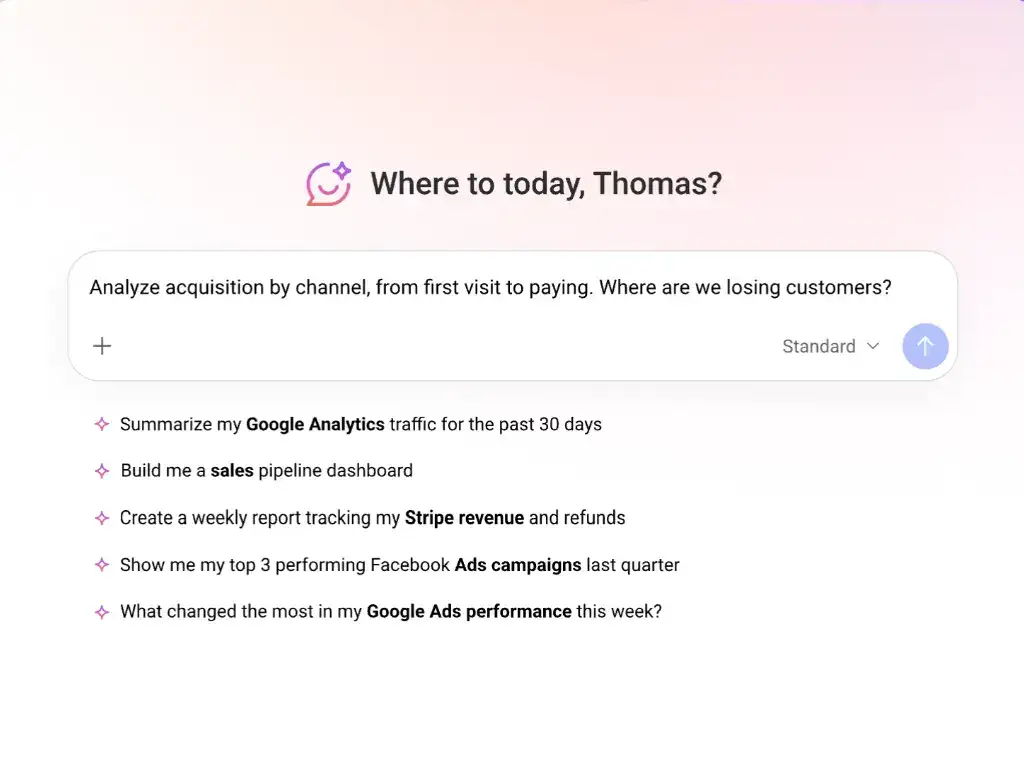
How Databox Genie Works in Practice
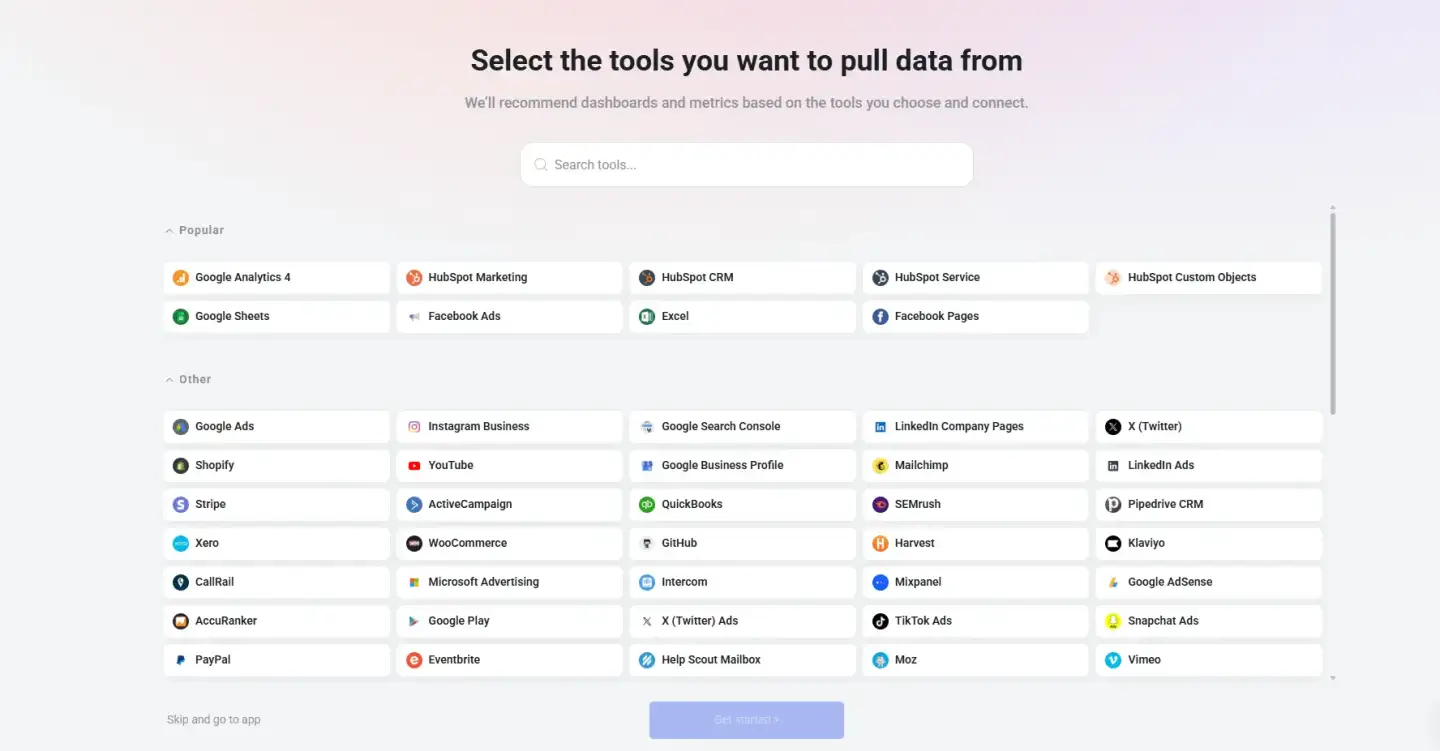
Getting started is straightforward. First, connect your data sources through Databox’s native integrations—CRM, advertising platforms, analytics tools, billing systems, and more. Databox standardizes the metrics so everything speaks the same language.
Next, open Genie’s chat interface inside your Databox workspace and ask a question in plain English. Genie can analyze connected metrics, compare time periods, and return a contextual answer based on the data available in Databox.
Seeing Databox Genie in action makes the experience much more tangible. A short demo or screen recording can show how a simple prompt such as “Why did revenue change last month?” turns into a contextual, visual answer based on connected business data. For readers evaluating the tool, that kind of walkthrough helps connect the product description to a real use case.
It supports three common types of analysis tasks:
Analyze: Explains changes, spots trends, and uncovers drivers behind the numbers.
Create: Builds new metrics, dashboards, or reports from a simple prompt.
Explore: Lets you drill deeper without menus, filters, or spreadsheets.
You can share entire conversations with teammates via a link, keeping everyone aligned without recreating work. The experience is designed to make analysis feel more accessible, consistent, and easier to share across the team.
Realistic Use Cases: How Teams Apply Databox Genie Daily
The real power of Databox Genie shows up in everyday workflows. Here are practical examples drawn from how marketing, SaaS, and agency teams actually use it.
Identifying Why Revenue Changed
A SaaS revenue leader notices MRR dipped 8% month-over-month. Instead of exporting reports from Stripe, HubSpot, and product analytics, they ask Genie: “Why did MRR change last month?” Genie pulls the data, breaks down new business versus expansion versus churn, flags the specific customer segment driving the shift, and even surfaces the related marketing campaigns from the prior period. The team can identify a pricing test that may have contributed to higher churn and use that insight to adjust the next campaign faster.
Answering Leadership’s Marketing Questions Instantly
During a quarterly review, the CMO asks, “Which channels drove the most qualified pipeline last quarter?” The marketing manager opens Genie and types the question. Genie can return a ranked breakdown by source, complete with conversion rates and a side-by-side comparison to the previous quarter. No frantic dashboard hunting. The manager shares the Genie conversation directly into the meeting notes.
Connecting Pipeline Health with LinkedIn Engagement
A B2B SaaS growth team wants to understand the relationship between content performance and sales outcomes. They prompt Genie: “How does LinkedIn engagement correlate with pipeline created this month?” Genie cross-references LinkedIn analytics data with CRM pipeline stages, highlights which post types generated the highest-quality opportunities, and flags a dip in engagement that preceded a slowdown in deal velocity. The insight leads to a quick pivot in content strategy.
Building Dashboards Faster
Rather than starting from scratch, a marketing operations specialist types: “Create a dashboard showing paid acquisition performance by channel, including cost per lead and ROI.” Genie generates the layout, pulls the correct metrics, and adds trend lines automatically. The specialist tweaks one prompt—“Add comparison to last month”—and the dashboard updates instantly. This can significantly reduce the time needed to build and update dashboards.
Preparing Reports More Efficiently
Agency account managers used to spend Friday afternoons compiling client reports. Now they ask Genie for a performance summary: “Give me a narrative overview of last month’s results with key wins and risks.” Genie produces a polished, data-backed narrative that can be copied into a client email or slide deck. The manager reviews the insights, adds context, and sends a professional update—helping reduce the time spent preparing recurring reports.
Asking Performance-Related Questions in Plain English
Non-technical team members benefit most here. A content strategist asks, “Which blog posts drove the most organic traffic and leads in Q1?” Genie surfaces the top performers, shows traffic sources, and even suggests related pages that underperformed. No filters. No SQL. Just an answer ready to inform the next content calendar.
These examples show realistic ways teams can use Databox Genie to reduce manual reporting work and get answers faster.
How Databox Genie Helps Marketers, Agencies, and SaaS Teams
Marketers gain the ability to test hypotheses on the fly. Instead of waiting for end-of-week reports, they ask follow-up questions in real time and iterate campaigns before budget is wasted.
Agencies impress clients with proactive insights—“I noticed a dip in LinkedIn-sourced pipeline; here’s what the data shows”—instead of reactive updates. SaaS teams keep leadership aligned with clear, visual explanations of why key metrics moved, shortening the gap between observation and action.
Across all three groups, the common benefits are easy to understand in day-to-day work:
Reduced time spent building or refreshing dashboards and reports.
Fewer meetings spent clarifying data questions.
More confidence in decisions because answers are based on connected business data.
Greater accessibility—anyone on the team can ask sophisticated performance questions without analytics expertise.
The result is a cultural shift: data stops being a bottleneck and becomes a daily advantage.
Databox is also preparing an upcoming feature called Teach Genie. This will allow users to share their goals, priorities, and business definitions once, so Genie can use that context to deliver insights that feel more relevant and grounded in how the business actually operates. As this feature rolls out, it should make Genie even more useful for teams that want analysis tailored to their specific business model and reporting language.
Key Takeaways
Databox Genie helps turn plain-English questions into contextual answers based on connected business data.
It excels at explaining why metrics change, not just showing what changed.
Teams can build dashboards, generate metrics, and draft reports using simple prompts—no technical skills required.
Marketing, SaaS, and agency professionals can reduce the time spent on analysis and recurring reporting.
Insights stay grounded in connected business data rather than broad, general-purpose prompts.
Conclusion
Traditional analytics tools show you the numbers. Databox Genie helps you understand what they mean and what to do next. By combining centralized data with conversational AI, it gives marketing, SaaS, and agency teams the speed and clarity they need to stay ahead.
If your team spends too much time chasing answers instead of acting on them, Databox Genie offers a practical way to reclaim those hours and make every decision more informed. For teams that want to explore it before committing, Databox also offers a free 14-day trial of the Growth plan, making it easier to test Genie with live connected data in a real reporting workflow. Ready to ask your data better questions?
FAQ
Databox Genie is the AI analyst built directly into the Databox platform. It lets teams ask business performance questions in plain language and get data-based answers, explanations, and supporting visualizations based on connected data.
Genie is designed to work with the data connected inside Databox, which can make its answers more contextual and useful for business teams.
Yes. The interface is designed for plain-English conversation, making performance analysis accessible to marketers, executives, account managers, and founders alike.
Not entirely—it enhances them. Many teams still use dashboards for ongoing monitoring, but they rely on Genie for quick explanations, deep dives, and faster report creation.
Teams may start seeing time-saving benefits once their key data sources are connected and they begin using Genie for recurring reporting and analysis tasks.